
Costs and the purchase decision – heat pumps still too often sold as a premium product
Heat pumps are a possible substitute for standard fossil fuel based burners. Functionally equivalent, they provide heating and sanitary hot water. Reversible units have the ability to also provide cooling, which improves efficiency and adds additional comfort for the user.
In a rational world, consumers would base their purchasing decision on a mix of cost and comfort criteria. Thus, they would calculate the total cost of ownership (TCO) over the expected useful life of each alternative and choose their heating system accordingly. In taking a TCO perspective, the higher initial investment in a system can be overcompensated by lower operating costs. Obviously, the outcome of such a calculation depends on the difference in initial investment, on the difference in energy demand and on the difference in energy cost (prices at the time of decision and their expected development trajectories over the useful life). In reality, investors are more often guided by a short-term focus on investment cost only, ignoring the TCO perspective.
In the past, a TCO perspective revealed a cost advantage for heat pumps due to much lower operating costs, this advantage decreased significantly in many markets as a result of a parallel reduction of fossil fuel prices and an increase in the cost of electricity. This leads to a less favourable energy price ratio for heat pumps. To overcome the resulting negative impact on sales developments, manufacturers need to focus more strongly on creating awareness both for the concept of total cost of ownership as well as of the side benefits of heat pump systems increasing cost competitiveness over the useful life of the product: influencing factors are increased efficiency at current cost and cost reductions across the value chain offering additional value to the consumer such as the integration of heat pumps into the buildings ventilation system, the use of electricity produced on site, the employment of free waste heat from cooling processes for heating and sanitary hot water. The latter is particularly noteworthy in large commercial buildings.
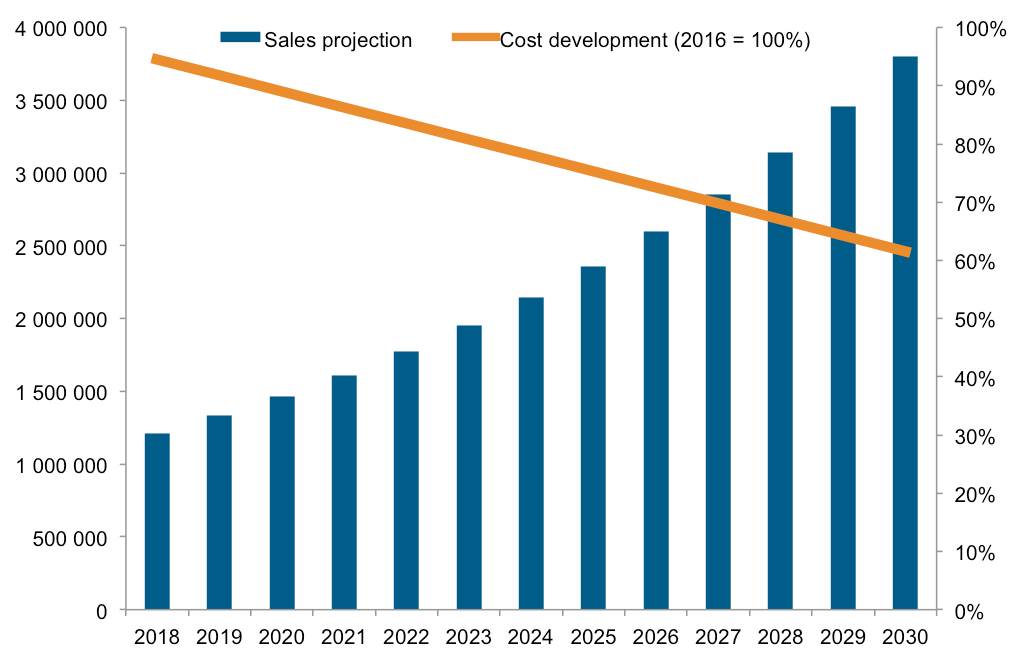
Learning curve effects are expected to materialise in the (near) future as a result of steadily increasing total aggregated sales. At current market growth levels the European heat pump sales will double every 8 – 10 years which should result in a cost reduction of approx. 22% by 2024 and approx. 39% by 2030. Figure 3.4-1 highlights the path for sales growth and costs. For this projection an annual growth rate of 10% is assumed. Further, the assumption for the cost development is 20% savings for each doubling of the sales volume.
Both cost and efficiency improvements can be expected from dedicated developments at the component level. Compressors are optimised for heat pump applications, expansion valves, three-way valves and control systems are getting more standardised and are sold in much larger numbers. The manufacturing of pre-fabricated sub-units (refrigerant cycles, complete outdoor units) that are then integrated into the casing and connected to the hydronic system greatly helps to reduce manufacturing time and cost.
Standardisation on the heat pump unit itself will allow for an easier, faster installation, whilst also limiting the scope for installation quality issues. Subsidy schemes and other incentive programs by government and industry stakeholders can in principle also help to overcome cost disadvantages. They need to be designed with a long-term perspective, ideally independent of government budgets.
The most cost-efficient impact on heat pump market development will be the development of a decarbonisation pathway for society in general and the heating/cooling sector in general. If governments develop these plans, announce them, and set a time table for their execution, industry can and will adjust R&D as well as production planning. End users will react likewise. If it becomes clear that regions will be disconnected from the gas grid, investors will stop choosing combustion technology today in order to avoid the disadvantage of system change in the future.
Since none of this change can be financed by government money alone, it is of paramount importance to align the individual's economic rationale with the goals of society. Governments must create a political framework that makes the most helpful solutions to fight climate change the ones that are most interesting from an economic perspective of the investor/decision-maker. Only then will it become more interesting to buy low/no emission heating and cooling systems today.
Systematically, the most important step to take in this context is the introduction of a price on the use of Carbon (in other words: make CO2 emissions expensive). Such measure will guide investment to low CO2 emitting solutions automagically. The same effect will result from creating a business case for the use of renewable energy, here in particular for using these sources flexibly. It is expected that the new electricity market design regulation and Directive will have such an impact, as they create the foundation for new business models honouring storage capacity and the provision of demand response potential.
Energy price ratio
The energy price ratio is the ratio between the price of electricity (i.e. the auxiliary energy used by most heat pumps) and the price of 1 kWh of useful heating energy delivered by the competing technologies. It is based on the use cost of energy (excluding annual fees, meter readings etc.) and includes efficiency losses of the fossil fuel boiler. The energy price ratio shows the operating cost of heating systems using different types of fuel vs. the cost of electricity: a heat pump system has a comparative operating cost advantage over competing technologies whenever the seasonal performance factor (SPF) in the location of application is higher than the energy price ratio. The larger the difference between SPF and energy price ratio, the bigger the advantage. Chart 3.4-1 shows a comparison of energy price ratios for all countries with data available. The red dashed line indicates the estimated average SPF of all installed heat pumps.
The graphs show that electric compression heat pumps are very cost competitive in comparison to oil systems across Europe. However, the low gas price has harmed their competitiveness versus gas boiler technology, and the sharp decline of oil prices even led to an upswing of oil boiler sales.

Building and construction
While construction activity is on a higher level compared to 2010 (construction index = 100) in most European countries, the mediterranean countries haven't yet reached pre-crisis levels.
Only a few countries' construction sectors could defy the economic struggle caused by the pandemic. Germany, Estonia, Portugal and Sweden enjoyed improved market conditions for heat pump sales in 2021, compared to 2021. Sales growth in these countries is matched by growing construction indicators. In Norway and France, a slowdown of construction activities had an impact on sales.
Stagnating or negative conditions in the other countries, however, can hardly slow down their growth. This can be interpreted as a positive sign of cycle-independent, resilient growth of the European heat pump industry.
Thanks to laws requiring high standards of energy efficiency for new buildings, heat pumps are profiting more than other heating and cooling technologies in the new-builds' market. This was the case in Scandinavian and Central European countries where growth of the sector helped sales of heat pumps in new buildings (Eurostat: Dataset naida_10_a10).

Household investment rate
The household investment rate is an indicator for the state of the market in the much bigger renovation branch. "The household investment rate is defined as gross investment (gross fixed capital formation; mainly dwellings) divided by gross disposable income (adjusted for the change in pension entitlements) of the household sector in national accounts. Household investment mainly consists of the purchase and renovation of dwellings” (Eurostat Glossary: Household investment rate. Download at https://ec.europa.eu/eurostat/statistics-explained).
Household investments increased in only four countries (Germany, Sweden, Portugal and the Netherlands, see Table 3.4-1). In all other markets, this indicator is negative in comparison to 2021, suggesting challenges in the renovation sector.
